|
The report designer |
  
|
|
The report designer |
|
You use the Report Designer to create new reports, and to modify existing reports.
Reports are made up of bands. The way data appears in a report is determined by the kind of band a report object (data field, image, line, shape, etc.) is in.
The Report Designer makes extensive use of popup menus. To display a popup menu, right-click a band or report object. You can also specify the text formatting (font, font size, color, and text alignment) from the Format toolbar. The text formatting affects all selected objects.
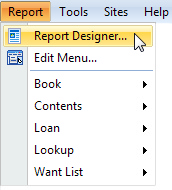
To open the Report Designer, choose Report Designer from the Report menu.